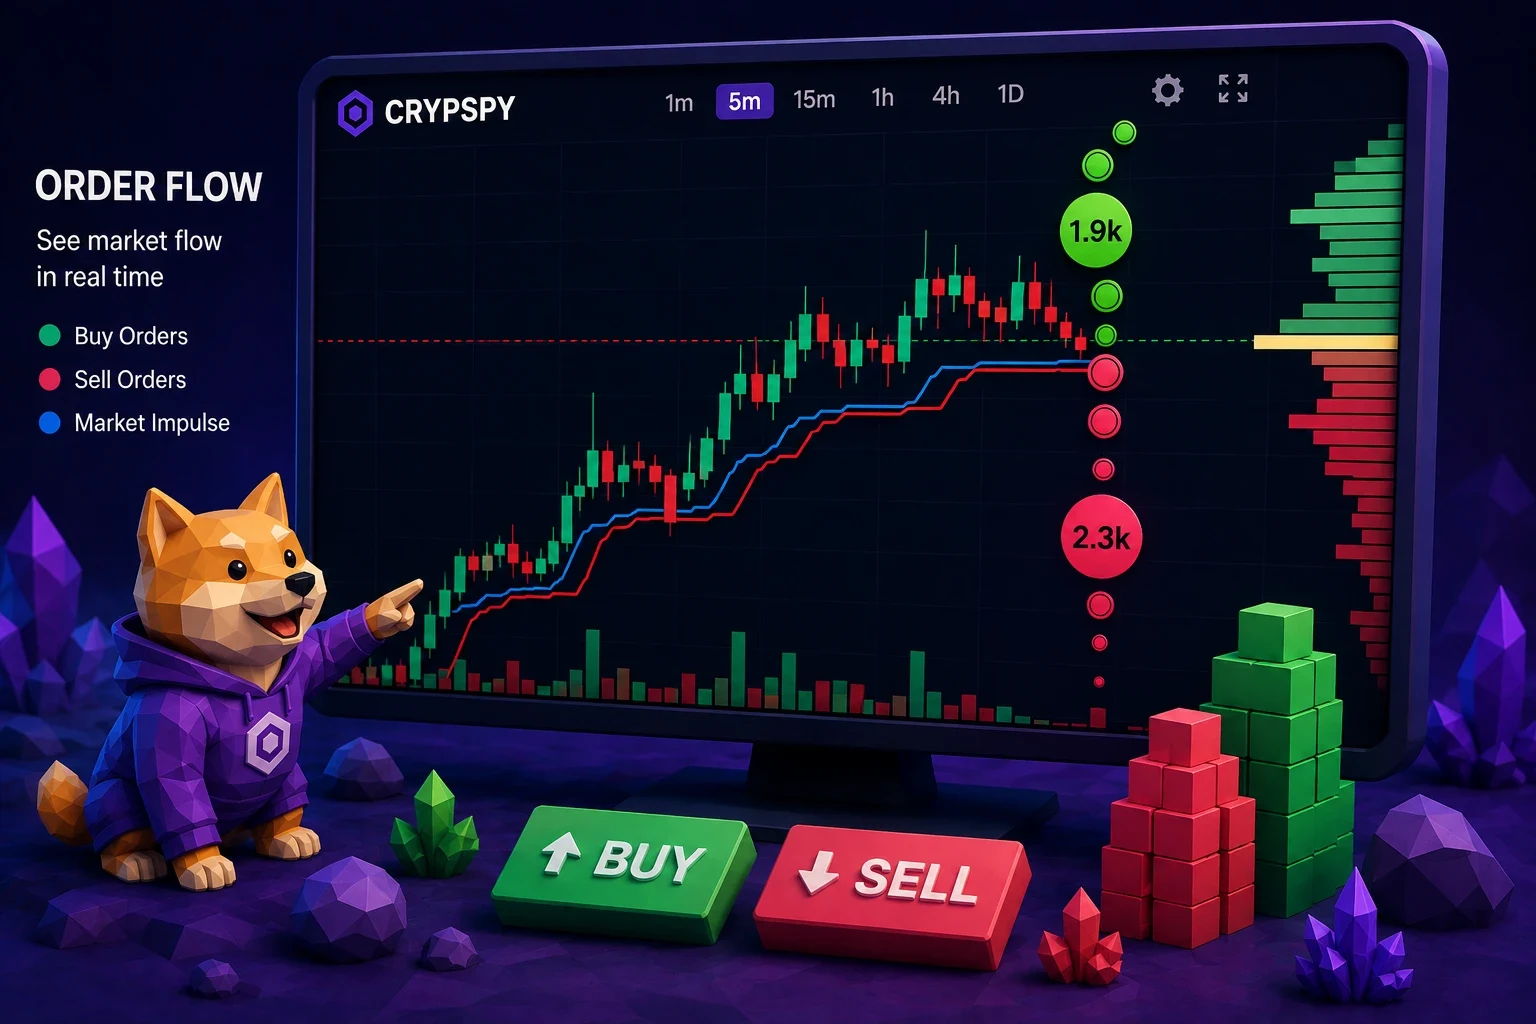
Candles show how the price changed. But behind every move are real trades by market participants.
With CrypSpy Order Flow, you can see large buys and sells directly on the cryptocurrency chart.
Each trade is displayed as a colored circle, and the size of the circle depends on volume. The bigger the circle, the larger the trade volume.
This lets you literally see where large buyers and sellers enter the market.
Large circle — large volume
CrypSpy turns the flow of trades into a simple visual tool.
Instead of a long tape of prices and numbers, you see orders right next to the chart:
- green circles — buys;
- red circles — sells;
- circle size shows volume;
- large trades stand out immediately.
Small trades don't distract you, while truly significant activity becomes visible at a glance.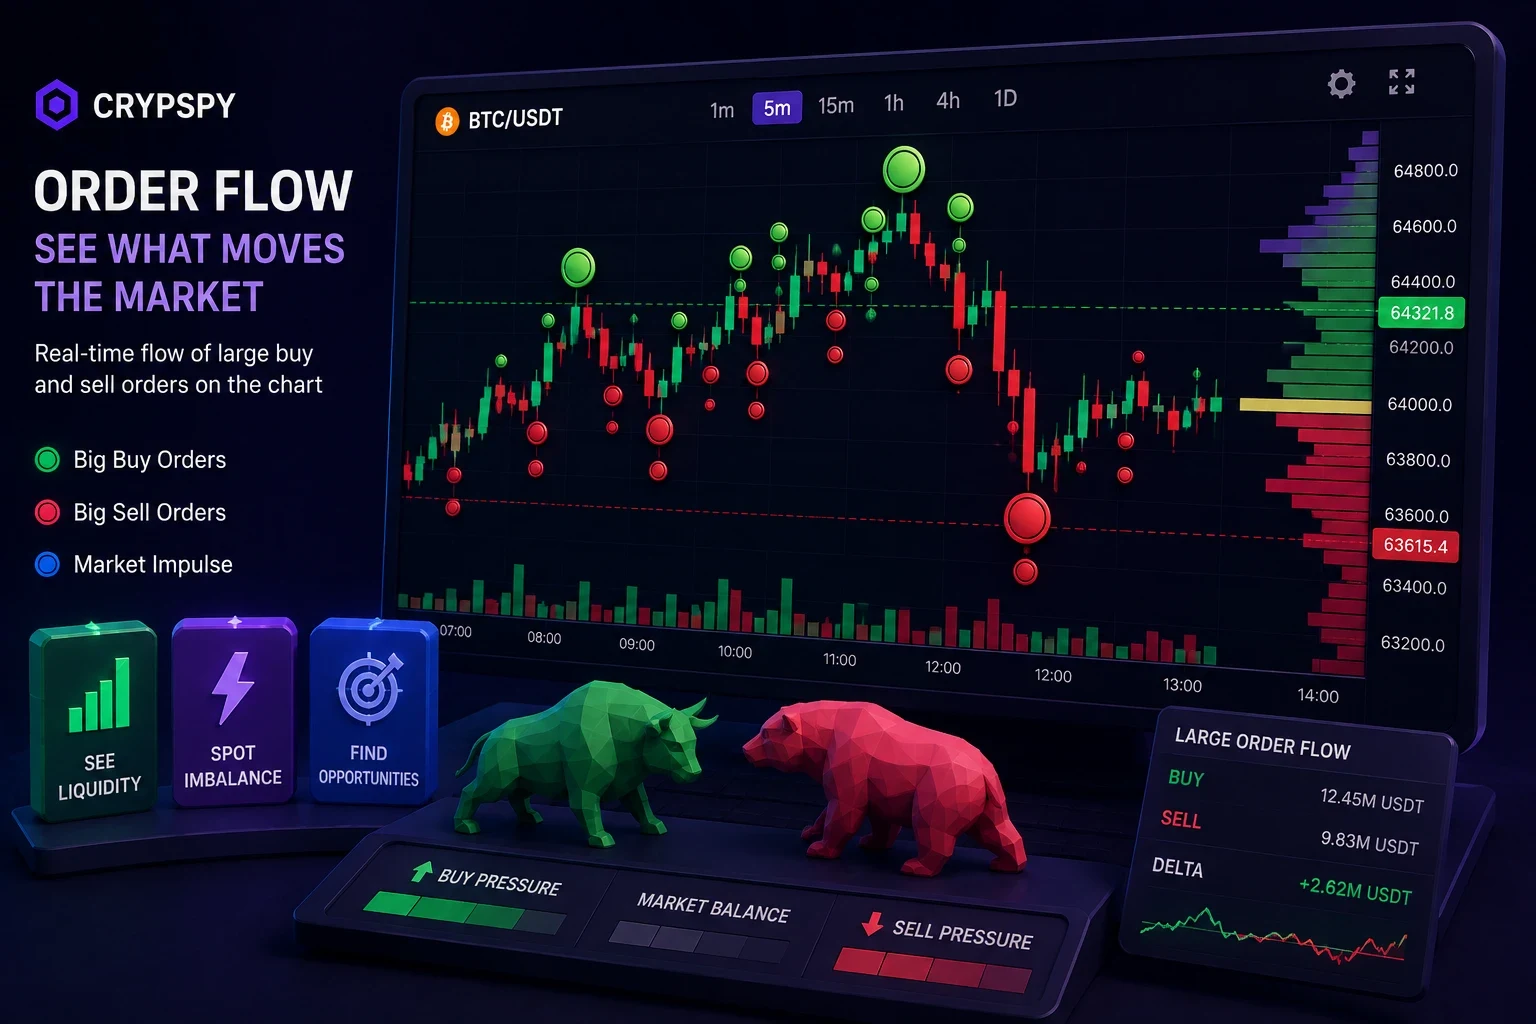
See where large buyers and sellers appear
Imagine the price is falling toward a support level.
A series of large green circles appears on the chart. This shows increased buyer activity right in that area.
Or the opposite: the price approaches resistance, where large red trades appear.
This doesn't guarantee a price reversal, but it gives the trader important additional information: notable trading activity has appeared at this level.
You can then compare it with the chart and your own strategy.
Stop studying the tape — see Order Flow on the chart
Classic trade flow analysis can look like an endless flow of numbers.
CrypSpy makes it visual.
You see the candlestick chart, the direction of price movement, and large trades at the same time. It becomes much easier to understand where the activity occurred relative to the current market structure.
This is especially convenient for quick crypto analysis, when you need to make decisions without constantly switching between multiple windows.
Spot large players' reactions at key levels
Order flow becomes especially useful near key price zones.
Watch for large buys and sells near:
- support and resistance levels;
- local highs and lows;
- trading range boundaries;
- trend lines;
- high-volume zones;
- breakout levels.
If large trades appear in an important area, that's an extra reason to pay attention to what's happening.
Filter the market by trade size
Not every buy or sell is of interest.
On an active crypto market, thousands of trades can take place, so it's important to quickly separate normal trading activity from large volumes.
CrypSpy's visualization solves this with marker size.
The larger the volume, the bigger the circle on the chart.
You immediately notice significant trades without manually analyzing every number.
Order flow + order book + volume
You can get even more information by using Order Flow together with CrypSpy's other tools.
For example, at a certain price, there is a large cluster of buyers in the order book.
The price approaches it.
At the same time, large green trades appear in the order flow.
And the Volume Profile shows increased volume in that area.
Now you see the situation from several angles at once:
where orders are placed → what trades are executed → how price reacts → what volume is concentrated at the level.
Such analysis gives far more information than a regular candlestick chart.
One chart — more market data
In CrypSpy, you can combine order flow with:
- the order book;
- large order clusters;
- Volume Profile;
- volume clusters;
- signal levels;
- support and resistance;
- trend lines;
- technical indicators.
Instead of using several separate services, you can analyze all the necessary data right next to the price.
Don't just watch the price — see who's behind it
When a large trade occurs in the market, it shouldn't get lost among thousands of small operations.
CrypSpy Order Flow shows large buys and sells right on the chart, and the circle size helps you instantly gauge the trade volume.
You see where buyers become active, where sellers appear, and how price reacts to that activity.
Turn on Order Flow in CrypSpy and see the market beyond the regular candlestick chart.
