
Price doesn't move on its own. Behind every move are buyers and sellers placing orders at different price levels.
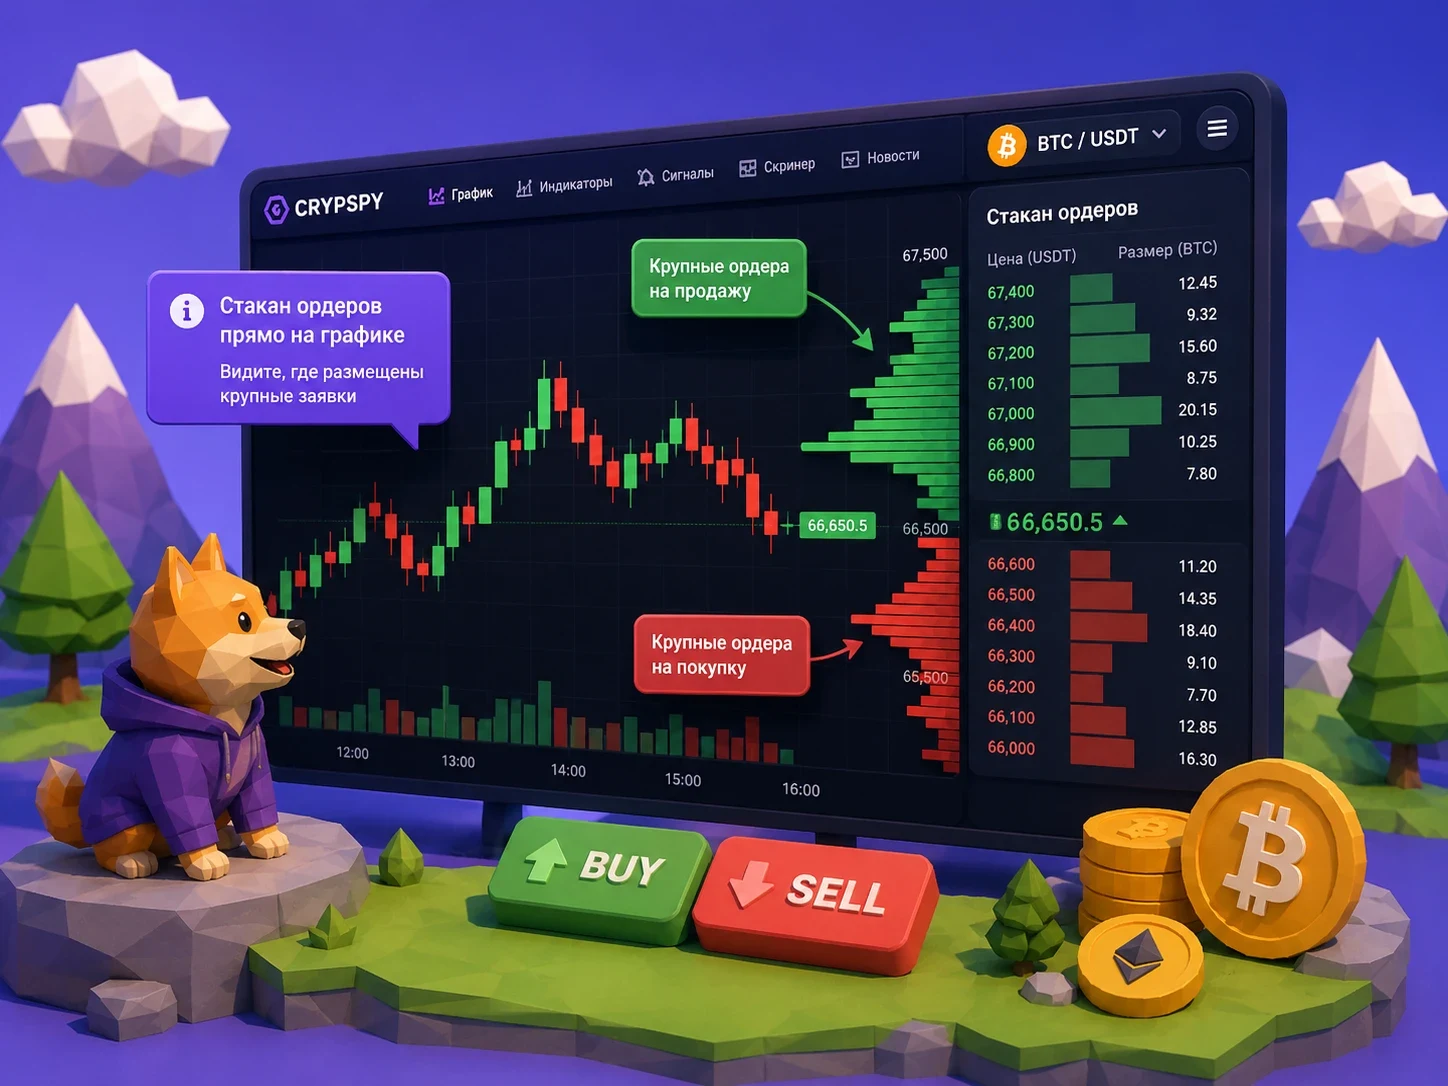
In CrypSpy, the order book is displayed directly on the chart. You immediately see where large buy and sell orders are concentrated and can take these zones into account when analyzing the market.
Don't just watch the price — see where the market is ready to buy and sell.
Large Orders Visible Right on the Price
In a typical exchange order book, a trader sees a constantly changing list of prices and volumes. To use this data, you have to manually match it against the chart.
CrypSpy does this visually.
Large orders and order book densities are displayed directly on the corresponding price levels of the chart.
It immediately becomes clear:
-
where large buy orders are located;
-
where sell orders are concentrated;
-
which density the price is approaching;
-
where liquidity is significantly higher;
-
which zones are worth studying more closely.
Instead of a table of hundreds of numbers — a clear picture of the market.
See What Lies Ahead of the Price
A regular candlestick chart shows what has already happened.
The order book adds other information — which limit orders are currently placed above and below the current price.
For example, if the price is rising and a large density of sell orders lies ahead, this area can be considered a potentially important zone.
If large buy orders are concentrated below the price, that's another level worth attention.
This way the trader sees not only the price history but also the current order structure around the price.
Find Order Book Densities Faster
Not all orders are equally important.
Of particular interest are order book densities — price areas where a significant volume of limit orders is concentrated.
CrypSpy helps you quickly find such zones directly on the chart and compare them with:
-
support and resistance;
-
local highs and lows;
-
Volume Profile;
-
trading volume;
-
trendlines;
-
your own signal levels.
When several factors converge in one price area, the trader has more information for making a decision.
Order Book + Chart in One Workspace
The main advantage is that you don't have to constantly switch between the Order Book and the chart.
Price, candles, and order book densities are right in front of you at the same time.
See a large order — instantly assess its position relative to the price.
Notice an important density — instantly perform technical analysis.
The price has approached a zone of interest — you can carefully watch the market's reaction.
Less switching. More information on one chart.
Not a Trading Signal, but an Additional Advantage
A large order by itself doesn't mean the price will necessarily reverse.
Orders can be moved, canceled, or filled. Therefore, it's better to use the order book together with other analysis tools.
This is exactly where CrypSpy's capabilities become especially useful.
Combine the order book, Volume Profile, volume clusters, signal levels, and technical analysis on one chart to see the market from different angles.
See the Price. See the Volume. See the Large Orders.
Don't analyze the market blindly.
CrypSpy's order book shows large buy and sell orders directly on the chart, helping you find important price zones faster and understand where market participants' interest is currently concentrated.
Open a CrypSpy chart — and see not only where the price is moving, but also what large orders stand in its way.
