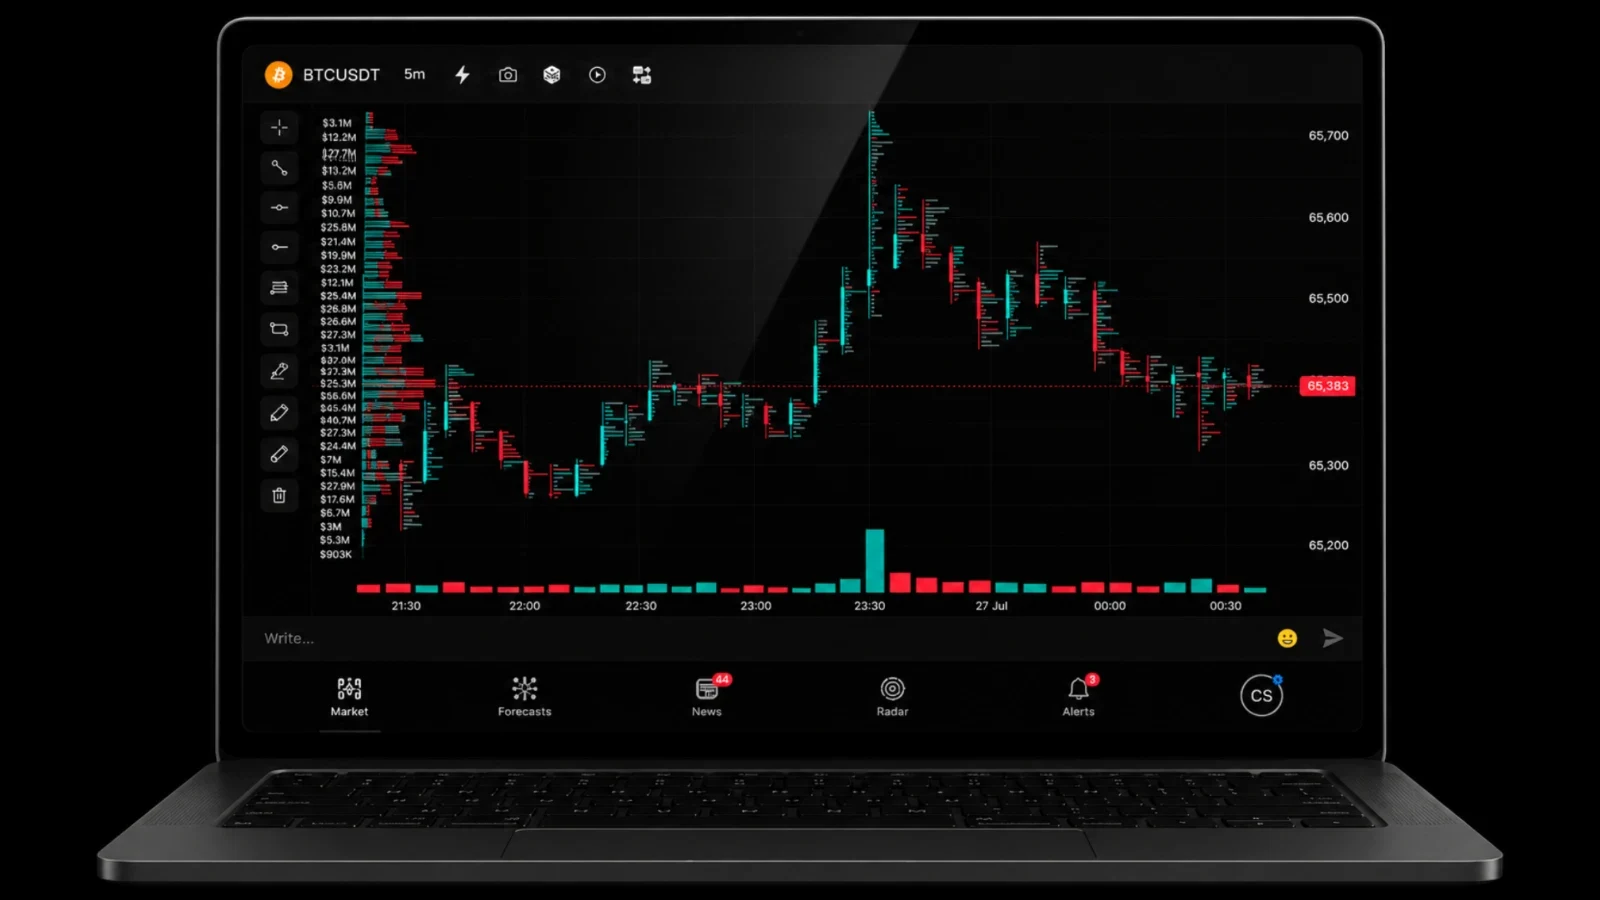
Most traders only analyze price movement. But price shows only the result.
To understand where the real battle between buyers and sellers took place, you need to see volume.
That's why professional traders use Volume Profile and cluster analysis.
In CrypSpy, these tools help identify where the main trading activity is concentrated, find strong levels, and see market structure much deeper than on a regular candlestick chart.
Price shows movement. Volume shows strength.
Two identical candles can look exactly the same.
But if one formed on high volume and the other with almost no activity, their meaning for the market will be completely different.
Volume Profile lets you see at which price levels the highest trading volume occurred.
These levels often become zones of support, resistance, accumulation, or distribution.
Look inside each candle
Cluster analysis shows how volume was distributed inside a candle.
You see not only the direction of movement but also understand:
-
where buyers were stronger than sellers;
-
at which prices the largest trades occurred;
-
where the market was building a position;
-
which levels really matter.
This allows you to assess the market much more accurately than using only classic indicators.
Find levels that are not visible on a regular chart
Many strong levels cannot be identified from highs and lows alone.
Clusters and Volume Profile help find:
-
hidden support levels;
-
strong resistance zones;
-
areas of high liquidity;
-
accumulation zones of large participants;
-
probable reversal points;
-
breakout confirmation levels.
This is where important trading decisions are most often made.
All volume analysis tools in one place
CrypSpy combines several tools for comprehensive market analysis.
On one chart you can use:
-
Volume Profile;
-
volume clusters;
-
horizontal levels;
-
trend lines;
-
parallel channels;
-
rectangle zones;
-
Fibonacci grid;
-
signal levels;
-
price alerts.
Instead of switching between multiple services, you get everything you need for analysis in one workspace.
Fewer guesses — more confirmations
No tool can predict the market.
But volume helps you understand which levels really matter.
If a level is confirmed by Volume Profile, cluster analysis, and your trading strategy, the probability of a quality entry becomes significantly higher.
That's why professional traders rarely analyze price separately from volume.
For any cryptocurrency
Use Volume Profile and cluster analysis for Bitcoin, Ethereum, Solana, XRP, BNB, TON, DOGE, SUI, and thousands of other cryptocurrencies.
Regardless of the chosen asset, you'll be able to find strong levels faster and make decisions based on market activity rather than assumptions.
Why traders choose CrypSpy
✔ Volume Profile right on the chart.
✔ Cluster analysis of every candle.
✔ Find strong support and resistance levels.
✔ Analyze liquidity and market activity.
✔ Combine volume analysis with trend lines, channels, zones, and Fibonacci levels.
✔ All technical analysis tools in one interface.
Analyze the market deeper
Price shows where the market is moving.
Volume helps you understand why it's moving there.
Use Volume Profile and cluster analysis in CrypSpy to see more than a regular chart, find truly strong levels, and make trading decisions with greater confidence.