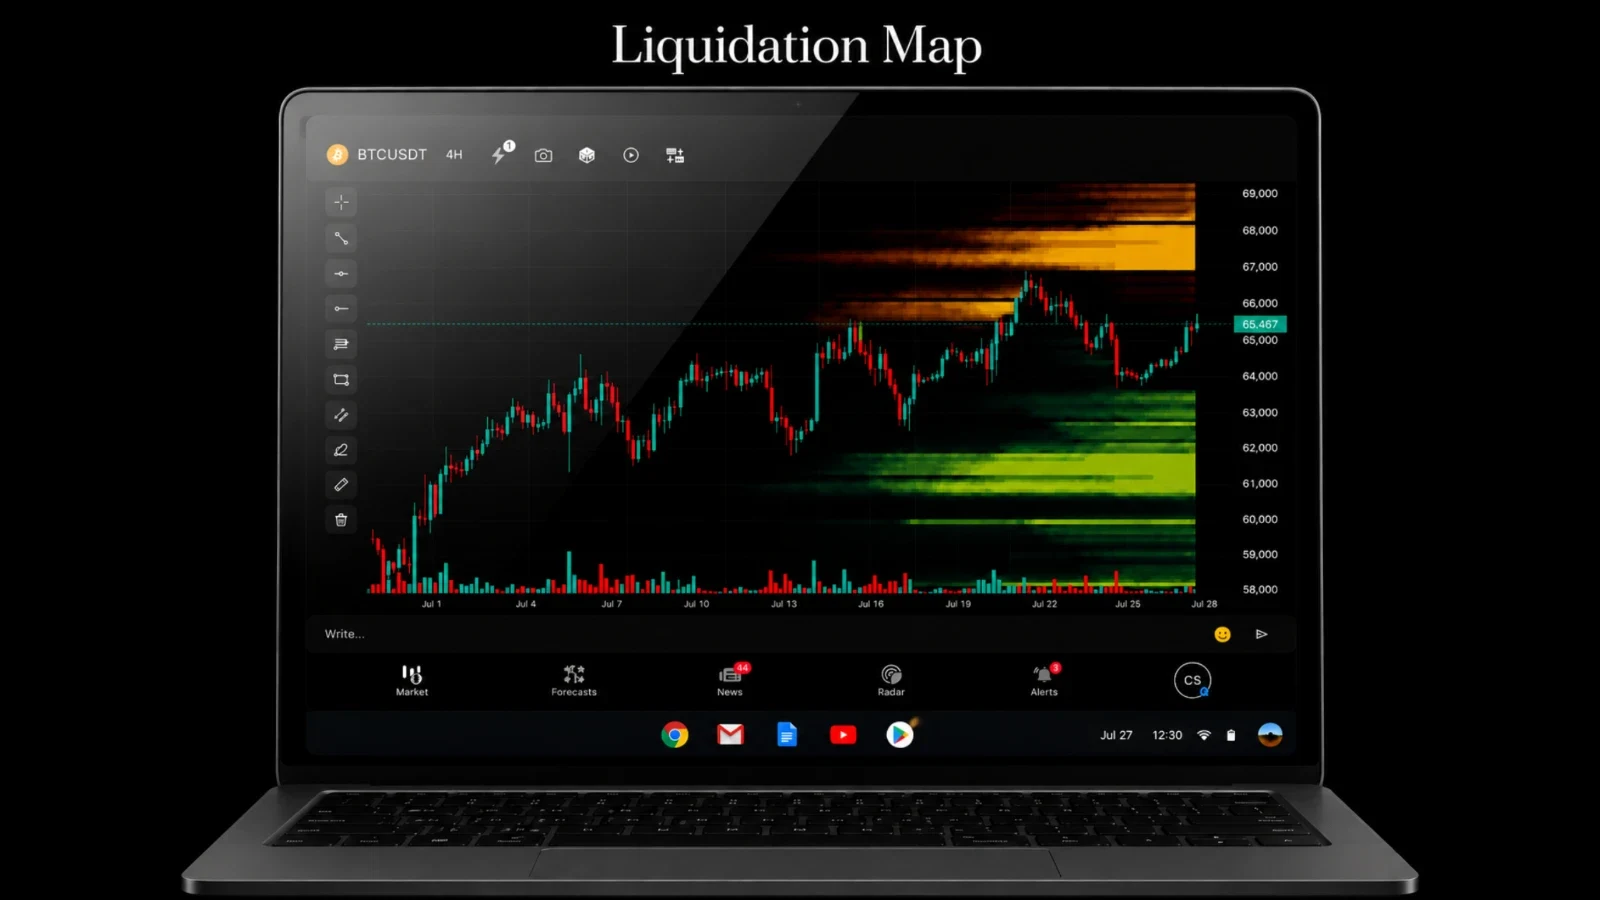
Liquidation Heatmap is a professional tool of the Crypspy platform that allows traders to see zones where potential liquidations of market participants are concentrated. The indicator displays levels at which large volumes of leveraged positions with a high risk of forced liquidation are located.
Unlike ordinary price charts, the heatmap shows hidden liquidity and helps determine where the price is most likely to go. This makes the tool especially useful for trading cryptocurrency futures.
What the liquidation heatmap shows
The indicator analyzes open interest, leverage, and market liquidity, then displays zones of possible liquidations on the chart.
On the map you can see:
liquidation levels of long positions;
liquidation levels of short positions;
liquidity density;
the most attractive price areas for major market participants;
potential price movement targets.
The brighter the color of an area on the heatmap, the greater the volume of liquidations concentrated at that level.
Why use the liquidation heatmap
Most cryptocurrency movements occur precisely in the direction of liquidity clusters. Market makers and large players often aim for price levels where there are many stops and liquidations.
Using the heatmap allows you to:
seek likely price movement targets;
find reversal points;
identify strong support and resistance zones;
confirm trading signals;
avoid entries against the main liquidity;
understand the behavior of major market participants.
Key advantages of the Crypspy indicator
The Crypspy liquidation heatmap has several advantages:
real-time data display;
convenient liquidity visualization;
high detail of price levels;
support for popular cryptocurrencies;
clear interface;
the ability to combine with other technical analysis indicators.
Thanks to this, the tool is suitable for both novice traders and professionals.
How to use the liquidation heatmap
Using the indicator is quite simple.
Step 1. Open the desired trading pair
Select the asset you are interested in, for example:
BTCUSDT;
ETHUSDT;
SOLUSDT;
XRPUSDT.
Step 2. Turn on the heatmap
After opening the chart, enable the Heatmap or Liquidation Heatmap display.
Colored zones of varying intensity will appear on the chart.
Step 3. Analyze the liquidity cluster
Particular attention should be paid to the brightest areas.
This is where the maximum number of potential liquidations is located.
Step 4. Compare the data with the price chart
It is not recommended to open trades based solely on the heatmap.
It is better to use additional tools:
volumes;
Open Interest;
CVD;
Delta Volume;
support and resistance levels;
clusters;
order book.
Comprehensive analysis significantly improves the quality of trading decisions.
How to interpret the liquidation heatmap
The most common scenarios are as follows.
Price moves toward the liquidation zone
Often the market seeks to test the area where a large number of liquidated positions are located.
After reaching the zone, the following are possible:
momentum acceleration;
liquidity sweep;
reversal;
consolidation.
Large number of long liquidations
If there is a large cluster of buyer liquidations below the current price, there is a possibility that the price will decline to that level.
Large number of short liquidations
If there are many sellers being liquidated above the market, the price may continue to rise to force their closure.
Best trading strategies
Liquidity sweep trading
One of the most popular strategies.
The algorithm is simple:
identify a large liquidation zone;
wait for the price movement;
wait for the market reaction;
look for an entry confirmation.
Trading with volume confirmation
If the price approaches the liquidation zone while volumes increase, the probability of a strong move increases significantly.
Usage together with open interest
Rising open interest and the presence of a large liquidation zone often become signs of preparation for a strong move.
Mistakes when using the heatmap
Beginners often make the same mistakes:
open trades based only on the heatmap;
ignore volumes;
disregard the news background;
use too much leverage;
do not set a stop loss;
trade against the global trend.
It should be remembered that the liquidation map shows likely movement targets but does not guarantee that they will be reached.
Who the indicator suits
The Crypspy liquidation heatmap is suitable for:
scalpers;
day traders;
swing traders;
futures market traders;
users working with leverage;
cryptocurrency market analysts.
Conclusion
The Crypspy liquidation heatmap is a modern analytical tool that helps find liquidity concentration zones and understand the actions of major market participants. By using the indicator along with volumes, open interest, cluster analysis, and classical technical analysis, a trader gets a more complete picture of the market and can make more informed trading decisions.